WCF performance monitoring is crucial for keeping your services running smoothly. Here's what you need to know:
- Key tools: Performance Monitor (Perfmon.exe), AppDynamics, Retrace by Stackify
- Important counters: Calls, Calls Per Second, Average Call Duration
- How to enable: Add
<diagnostics performanceCounters="All" />to your Web.config
Quick comparison of monitoring tools:
| Tool | Built-in | Real-time Monitoring | Advanced Analytics |
|---|---|---|---|
| Perfmon.exe | Yes | Yes | No |
| AppDynamics | No | Yes | Yes |
| Retrace | No | Yes | Yes |
Top tips:
- Set up alerts for critical thresholds
- Check performance regularly (daily, weekly, monthly)
- Monitor database queries and external service calls
- Adjust concurrency settings as needed
- Use custom counters for specific metrics
By tracking the right metrics and using these tools, you can spot and fix issues early, ensuring your WCF services perform optimally.
Related video from YouTube
What are WCF Performance Counters?
WCF performance counters are tools that monitor your Windows Communication Foundation services. They show you how your services are performing in real-time.
WCF has built-in counters that track:
- Service call volume
- Request processing speed
- Security issues
But here's the catch: These counters are off by default.
To turn them on, add this to your Web.config:
<system.serviceModel>
  <diagnostics performanceCounters="All" />
</system.serviceModel>
Types of WCF Performance Counters
WCF has three main counter groups:
- Service counters
- Endpoint counters
- Operation counters
Service counters look at overall service performance. Find them under "ServiceModelService 4.0.0.0".
Endpoint counters focus on message handling. Look for "ServiceModelEndpoint 4.0.0.0".
Operation counters track specific operations. Check "ServiceModelOperation 4.0.0.0".
Here's a quick example:
| Counter Type | Example Counter | Purpose |
|---|---|---|
| Service | Calls | Total service calls |
| Endpoint | Security Calls Not Authorized | Unauthorized access attempts |
| Operation | Calls Per Second | Operation call frequency |
Counter names can get long. They follow this pattern:
ServiceName@ServiceBaseAddress
(ServiceName).(ContractName)@(endpoint listener address)
(ServiceName).(ContractName).(OperationName)@(first endpoint listener address)
Sometimes, WCF uses hash values for very long names.
WCF performance counters give you the data to keep your services running smoothly. Now you know how to use them.
Setting Up WCF Performance Counters
Let's get those WCF performance counters up and running. Here are three ways to do it:
Changing the App.config File
Quick and easy:
- Open App.config
- Find
<system.serviceModel> - Add this line:
<diagnostics performanceCounters="All" />
Your config should look like:
<configuration>
    <system.serviceModel>
        <diagnostics performanceCounters="All" />
    </system.serviceModel>
</configuration>
Boom! All WCF performance counters are now on.
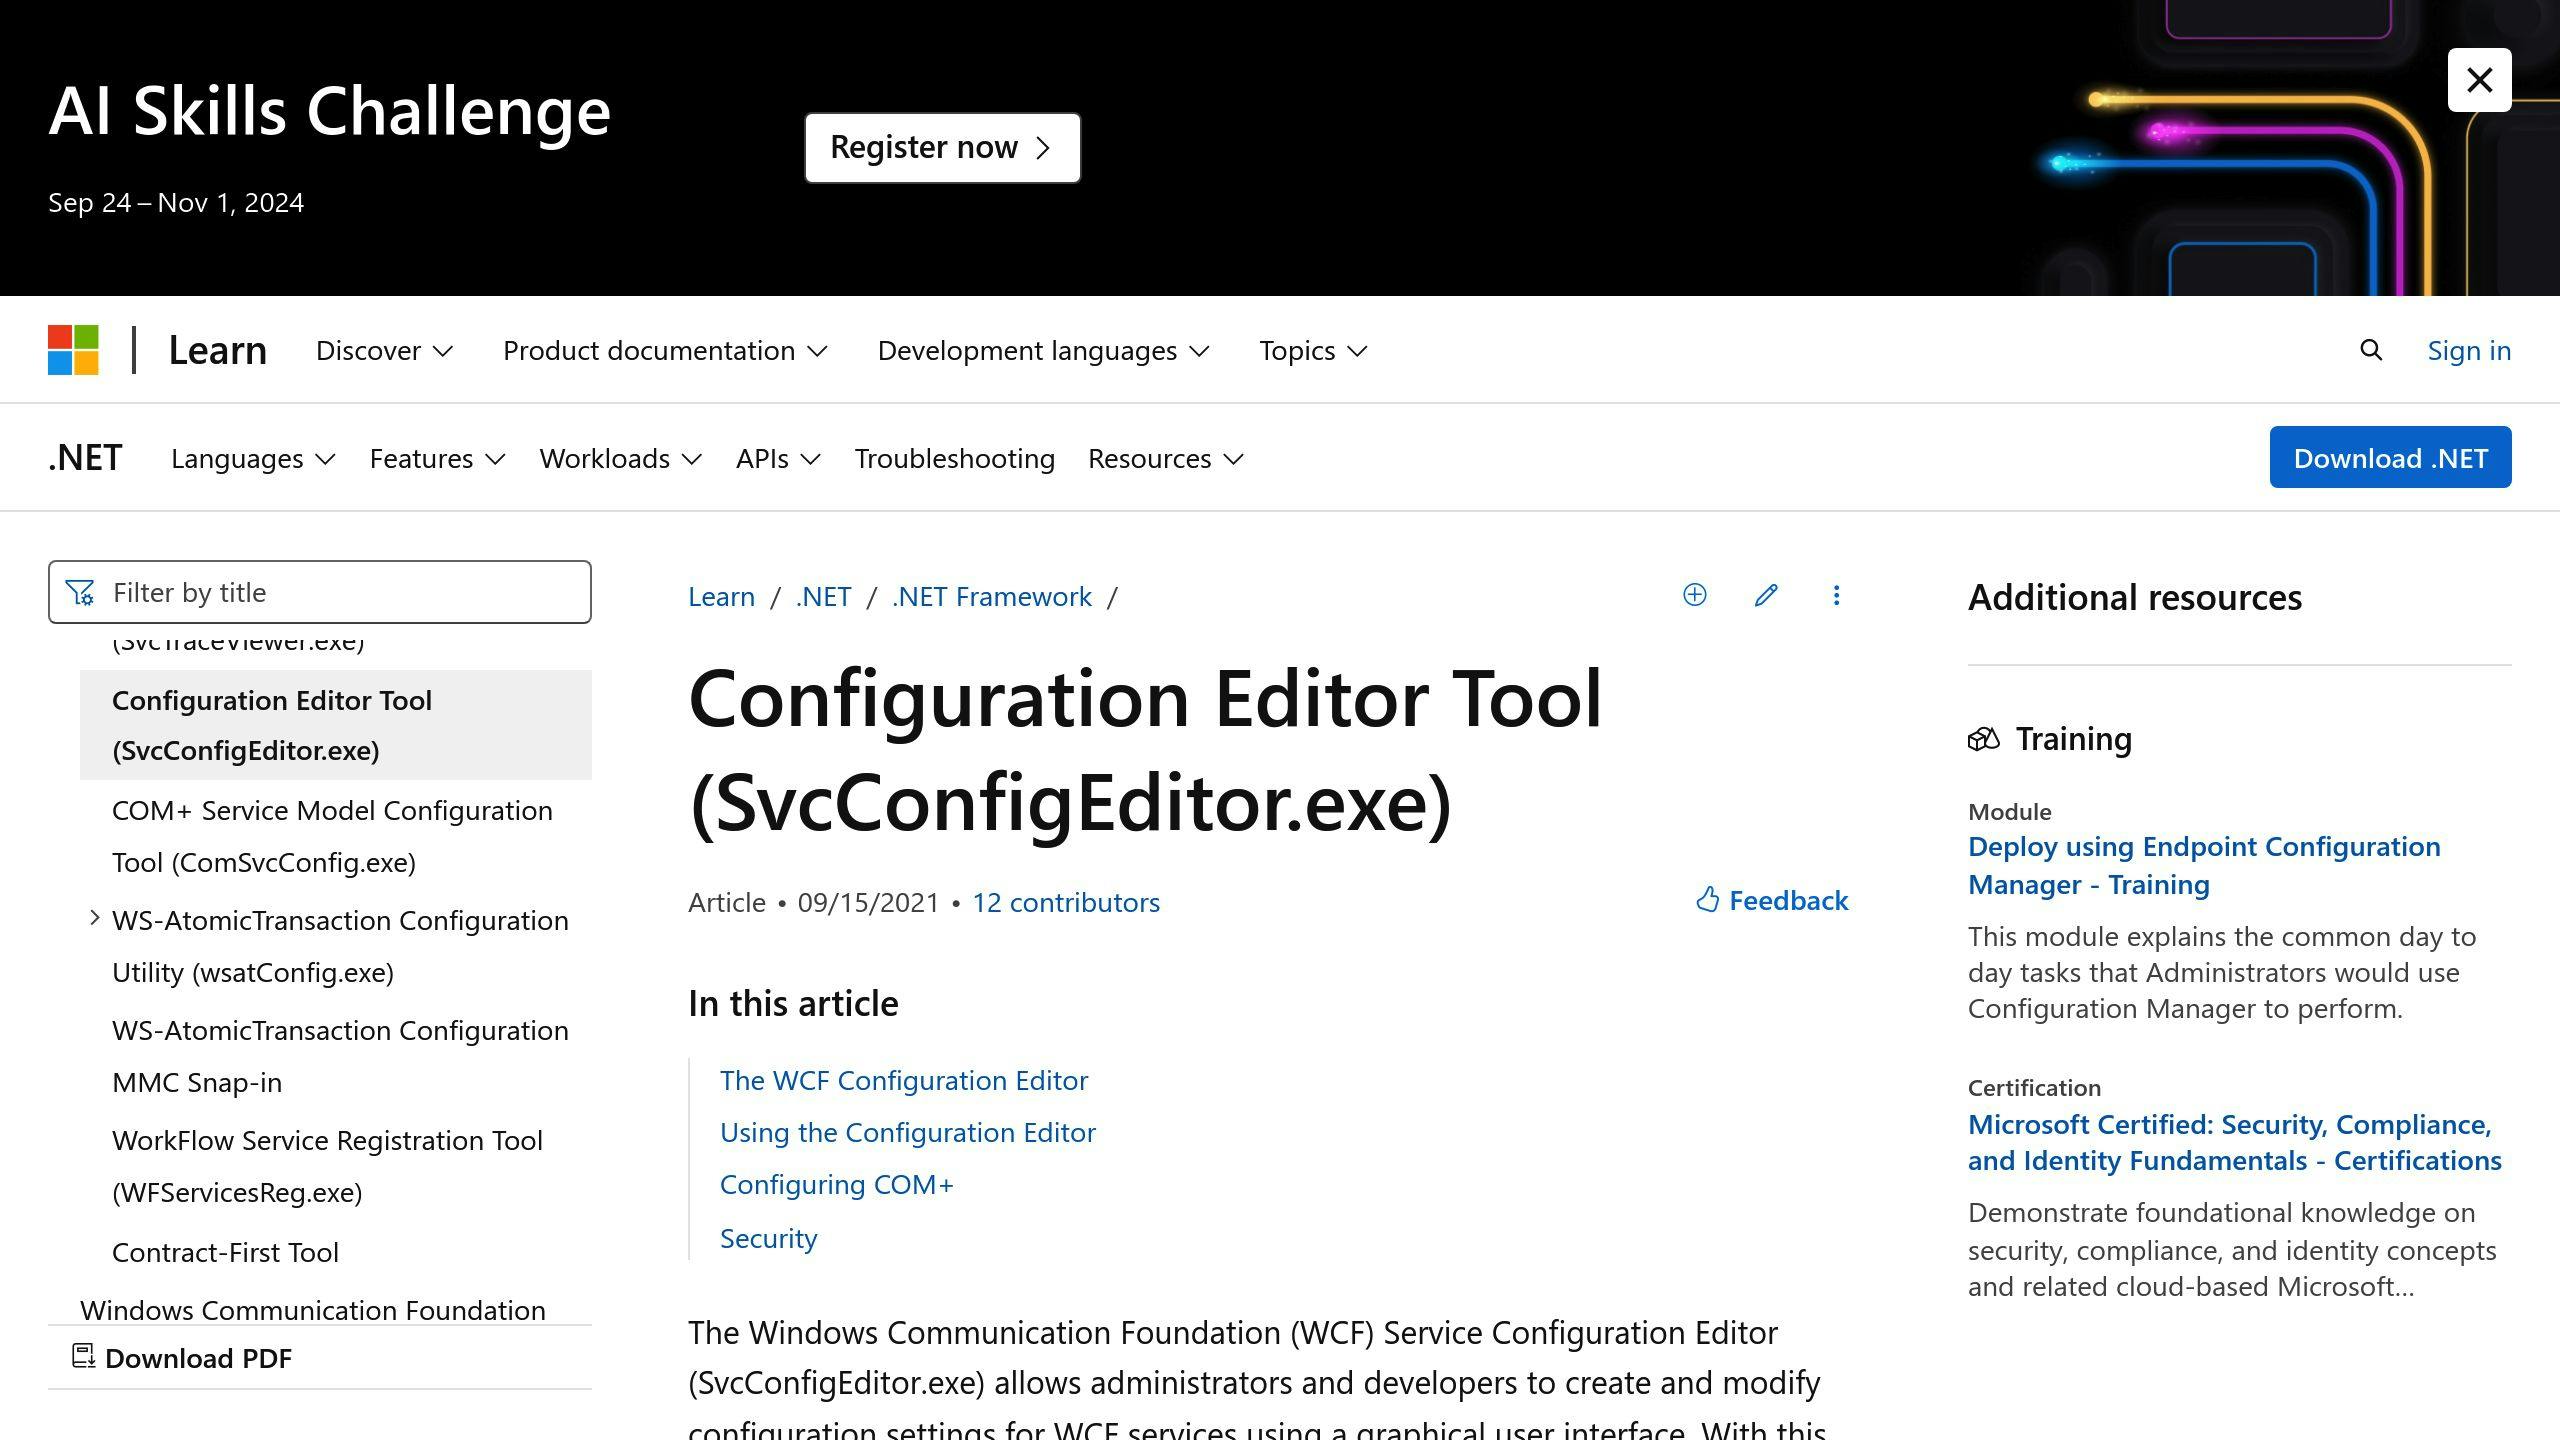
Using the SvcConfigEditor Tool

Not a fan of XML? Use Microsoft's SvcConfigEditor:
- Find SvcConfigEditor.exe in C:\Program Files\Microsoft SDKs\Windows\v6.0A\bin\
- Open your config file
- Go to Diagnostics
- Click Toggle Performance Counters
- Pick "All" from the dropdown
The tool does the XML magic for you.
Machine.config Settings
Want counters for ALL WCF apps? Edit Machine.config:
- Find Machine.config (usually in C:\Windows\Microsoft.NET\Framework\v4.0.30319\Config)
- Add the same
<diagnostics>line as in App.config - Save and restart
Now every WCF app has performance counters by default.
"You are correct. And this behaviour is by design. There is a limit on the length of a performance counter instance's name." - Microsoft
Heads up: WCF might shorten long counter names with hash values. Keep an eye on that.
Tools for WCF Performance Monitoring
Let's look at three tools to keep your WCF services running smoothly: Performance Monitor, AppDynamics, and Retrace.
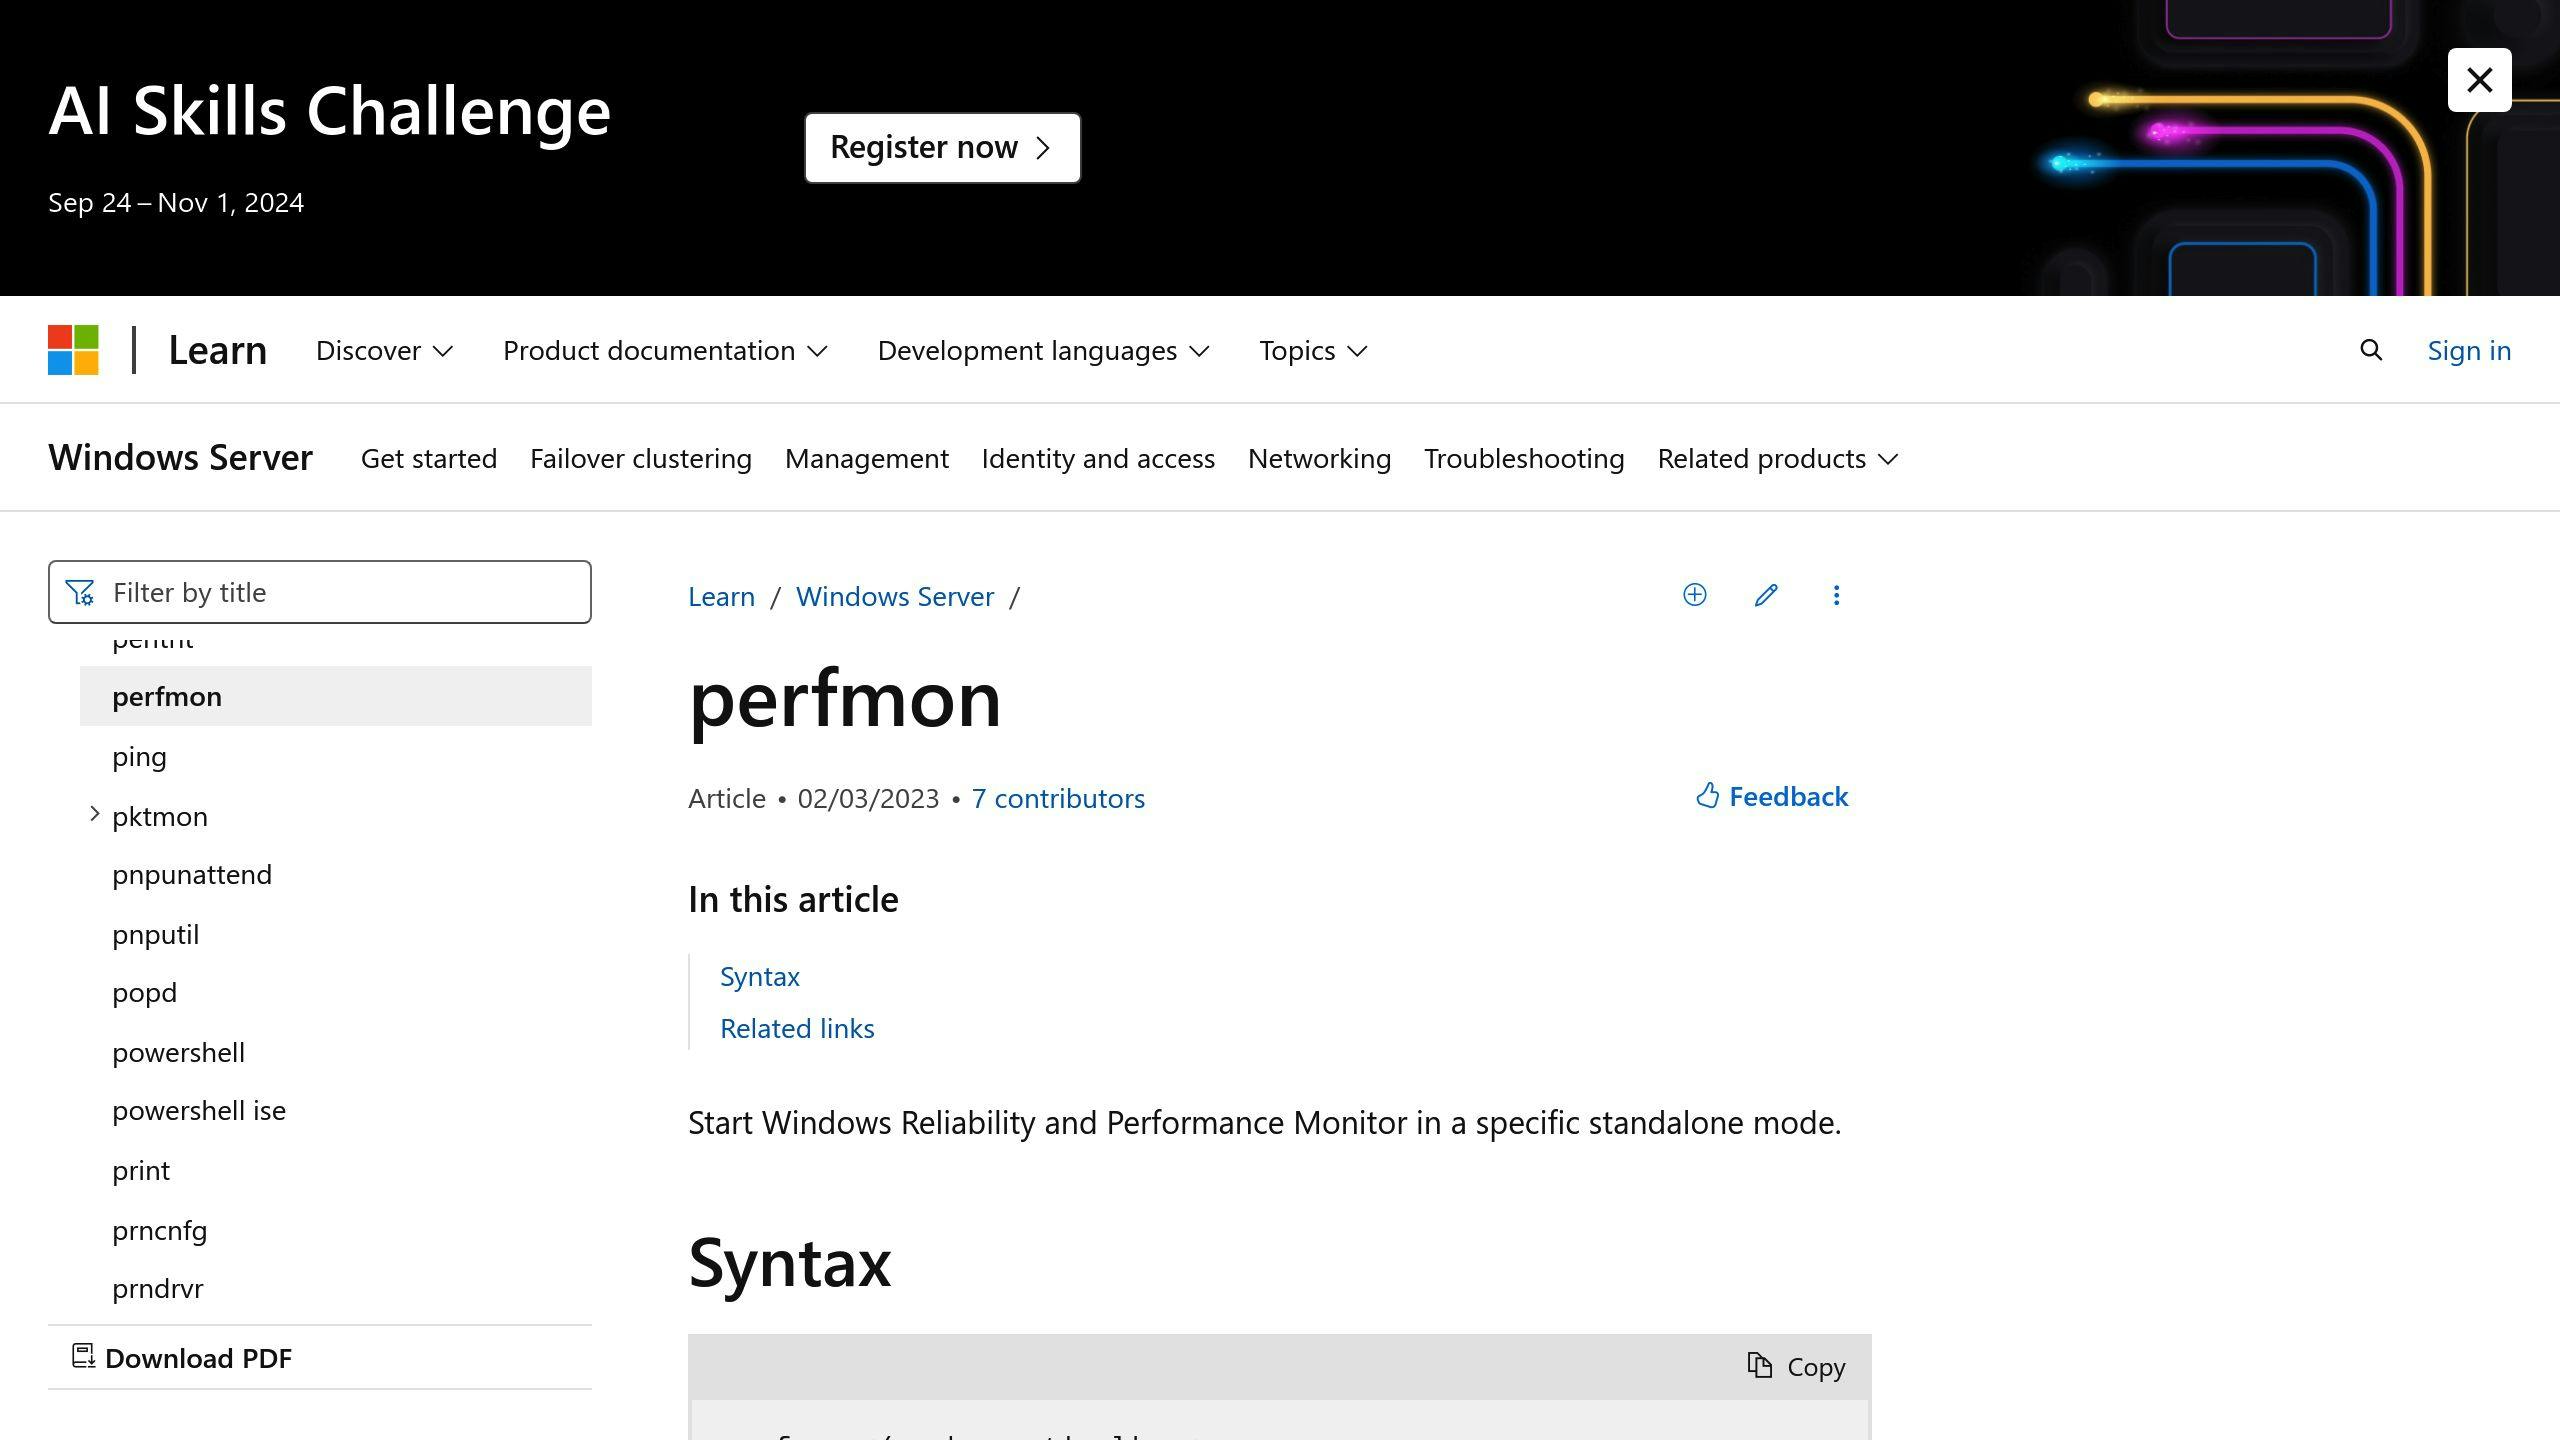
Performance Monitor (Perfmon.exe)

Perfmon.exe is Windows' built-in tool for tracking WCF performance. Here's how to use it:
- Open Run, type
perfmon - Add WCF counters like "Calls", "Calls per Second", "Security Calls Not Authorized"
- Watch your WCF performance in real-time
Tip: Set up a Data Collector Set to log performance data. Right-click DataCollector, hit File tab, set max samples, choose Circular Logging. Pick your format (.csv, .tsv, or binary).
AppDynamics

AppDynamics is a big player in Application Performance Monitoring (APM):
- 1.62% market share in APM
- 6,229 customers (4th in APM market)
- Covers IT Management, Mobile Analytics, System Administration
It gives you a full view of your .NET app performance, including WCF services.
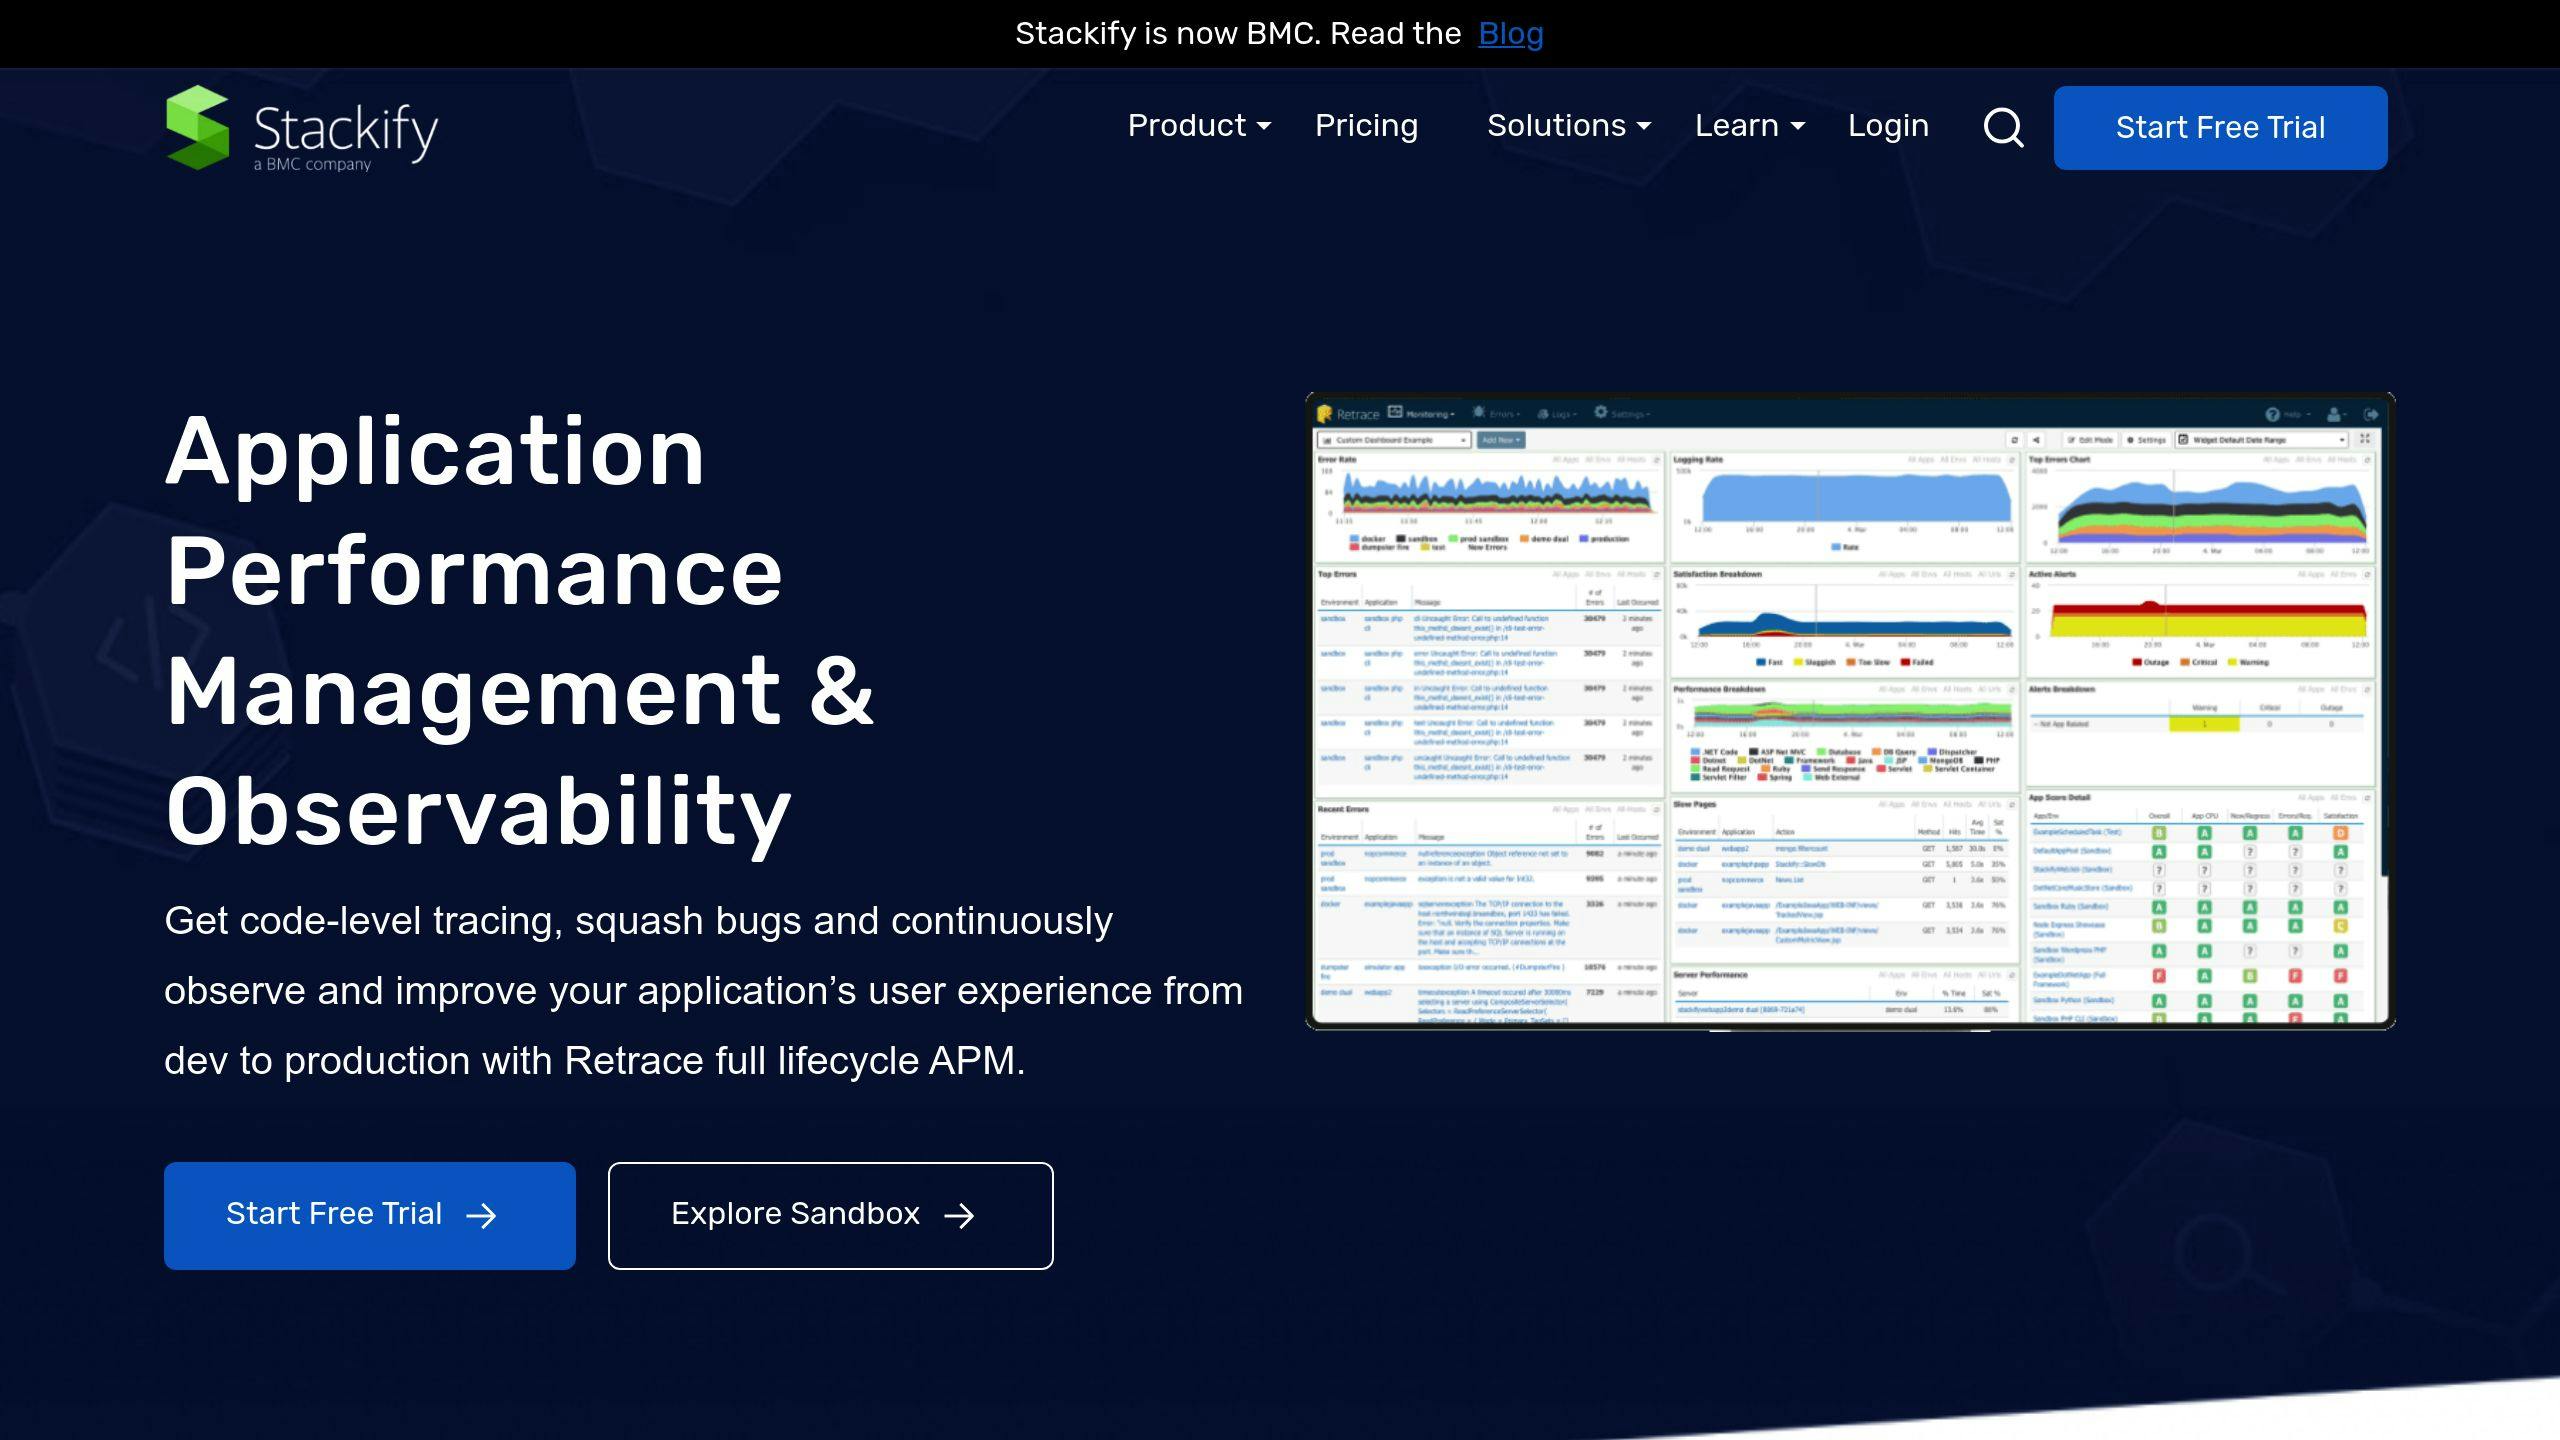
Retrace by Stackify

Retrace is built for ASP.NET WCF applications. It offers:
- Page performance tracking
- Apdex scoring for user satisfaction
- .NET performance profiling
Retrace is great for:
- Spotting slow database queries in WCF pages
- Tracking dependencies for quick problem-solving
- Combining code-level profiling with app logging
It even has an App Score that sums up user satisfaction, performance, error rates, and server metrics.
sbb-itb-29cd4f6
Key WCF Performance Counters
WCF performance counters help you keep tabs on your services. They show you how your service is doing, how well endpoints are working, and which operations might need a tune-up.
Service Model Service Counters
These counters give you the big picture of your WCF service. Find them under ServiceModelService 4.0.0.0. Here's what to look for:
| Counter | What It Tells You |
|---|---|
| Calls | Total service calls |
| Calls Per Second | How fast calls are coming in |
| Security Calls Not Authorized | Failed access attempts |
Use these to check your service's workload and spot security red flags.
Service Model Endpoint Counters
Endpoint counters show how your service handles messages. Look for ServiceModelEndpoint 4.0.0.0. Key counters:
- Calls
- Calls Per Second
- Security Calls Not Authorized
These help you find busy endpoints or security issues.
Service Model Operation Counters
Want to know about specific operations? Check ServiceModelOperation 4.0.0.0. Each operation has its own set:
- Calls
- Calls Per Second
- Average Call Duration
These point out popular or slow operations.
To use these counters, add this to your config file:
<configuration>
  <system.serviceModel>
    <diagnostics performanceCounters="All" />
  </system.serviceModel>
</configuration>
This turns on all WCF performance counters for your service.
Tips for WCF Performance Monitoring
Key Counters to Watch
When monitoring WCF performance, focus on these crucial counters:
- Calls: Total service calls
- Calls Per Second: Incoming call rate
- Average Call Duration: Identifies slow operations
Enable these in your Web.config:
<configuration>
  <system.serviceModel>
    <diagnostics performanceCounters="All" />
  </system.serviceModel>
</configuration>
Setting Up Alerts
Catch issues early:
1. Use Windows Performance Monitor (Perfmon.exe)
2. Create a Data Collector Set with performance counter alerts
3. Set up email notifications for critical issues
Example: Alert when "Calls Per Second" hits your threshold.
Regular Check-ups
Make performance checks routine:
| When | What |
|---|---|
| Daily | Key counters (Calls, Calls Per Second) |
| Weekly | Average Call Duration for all operations |
| Monthly | Trend analysis and resource adjustments |
For deeper insights, try tools like AppDynamics or Retrace by Stackify.
Fixing Common WCF Performance Problems
When your WCF services slow down, it's time to find the culprits. Here's how to spot and fix common issues:
Finding Performance Bottlenecks
Track these metrics with Windows Performance Monitor:
- "Average Call Duration"
- "Calls Per Second"
Set alerts for when they exceed your thresholds.
Checking Slow Database Queries
Slow queries often cause delays. To fix:
- Use SQL Server Profiler to find long-running queries
- Optimize with proper indexing
- Cache frequently accessed data
Checking External Service Impact
External services can slow things down. Here's what to do:
- Monitor response times of all external calls
- Use timeouts to prevent long waits
- Implement circuit breakers for graceful failure handling
Improving Concurrency
Boost performance by increasing concurrency. Compare default throttling settings:
| Setting | WCF 3.5 SP1 | WCF 4 |
|---|---|---|
| MaxConcurrentSessions | 10 | 100 * Processor Count |
| MaxConcurrentCalls | 16 | 16 * Processor Count |
| MaxConcurrentInstances | 26 | 116 * Processor Count |
Adjust these in your ServiceThrottlingBehavior:
<serviceBehaviors>
  <behavior name="IncreaseThrottling">
    <serviceThrottling maxConcurrentCalls="200"
                       maxConcurrentSessions="200"
                       maxConcurrentInstances="200"/>
  </behavior>
</serviceBehaviors>
Reducing Data Transfer
Too much data moving between layers? It can slow things down.
In one Enterprise app, excessive data transfer between web and app servers was the problem.
The fix? Data compression for WCF services. Use built-in IIS compression modules or implement a custom message encoder for more control.
Advanced WCF Performance Monitoring
Want to level up your WCF performance monitoring? Here are some pro techniques:
Custom Performance Counters
Create counters for your specific service metrics:
1. Make an XML file (*.xpc) in ~\App_Data\CMSModules\HealthMonitoring.
2. Define your counter:
<Counter Key="requestshomepage" Name="Home page requests" Description="The number of Home page requests." Type="NumberOfItems32" Enabled="True" OnlyGlobal="False" />
3. Use Visual Studio to make a custom module class for counter registration.
4. Turn on health monitoring in Kentico settings.
One team made 20 custom counters for things like "Report Loading" and "Login". Each had four counters: total ops, ops/second, average duration, and error count.
Reading Counters in Code
To grab WCF performance counters programmatically:
1. Enable counters in your WCF config:
<configuration>
  <system.serviceModel>
    <diagnostics performanceCounters="All" />
  </system.serviceModel>
</configuration>
2. Find the right category (like ServiceModelEndpoint) with PerformanceCounterCategory.GetCategories().
3. Get counter instances: GetCounters("Calls Duration").
4. Loop through instances to calculate metrics.
Heads up: WCF counter names can get long. If they do, WCF swaps part of the name with a hash.
Mixing with Application Logging
Combine performance monitoring and logging for deeper insights:
1. Turn on message logging in your config:
<system.serviceModel>
  <diagnostics>
    <messageLogging
      logEntireMessage="true"
      logMalformedMessages="false"
      logMessagesAtServiceLevel="true"
      logMessagesAtTransportLevel="false"
      maxMessagesToLog="3000"
      maxSizeOfMessageToLog="2000"/>
  </diagnostics>
</system.serviceModel>
2. Set log file location (default: c:\inetpub\wwwroot\WCFService\web_messages.svclog).
3. Use Service Trace Viewer (SvcTraceViewer.exe) to analyze logs.
Pro tip: Make sure your web app's identity can write to the log directory.
Wrap-up
WCF performance monitoring keeps your services running smoothly. Track the right metrics to spot and fix issues early.
Why it's crucial:
- Find and fix slow spots in your code
- See when to scale up for more users
- Keep your users happy with faster services
Key steps:
1. Set up the right counters
2. Use Performance Monitor for tracking
3. Check logs regularly
Don't just set it up and forget. Adjust your monitoring as your service grows.
Here's a real-world win:
We went from struggling with 100 users to handling over 100 clients easily. Our CPU usage flattened at 30% after we switched to NetTCP binding and added caching.
Small tweaks can make a big impact.
Focus on these areas:
| Area | Impact |
|---|---|
| Binding | Speed and scalability |
| Caching | Load time reduction |
| Serialization | Data transfer speed |
Keep monitoring, keep improving, and watch your WCF services thrive.


